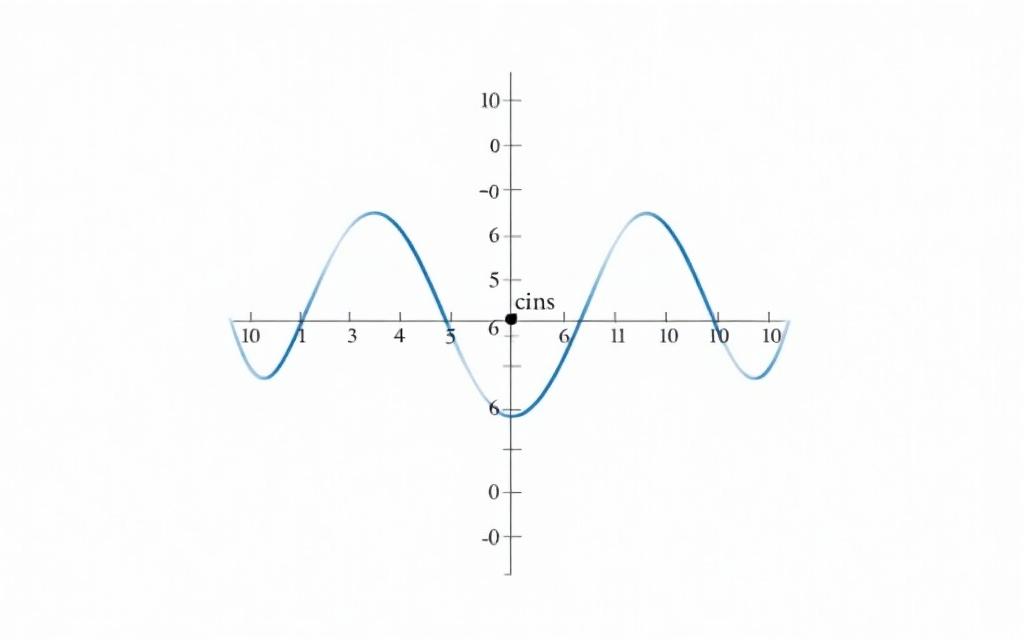
Type the math — get the graph, fast.
Enter an equation, coordinates, or parameters and Vizionary plots the result—labeled, explained, and ready for class.
Trusted by 50k+ students

Why Choose Vizionary
Correct by default
Auto-detects domains, intercepts, extrema, asymptotes, intersections, with clear labels.
Learn as you go
Optional steps (derivatives, regression, distance/area) explain why, not just what.
Presentation-ready
Clean axes, captions, accessible palettes, one-click PNG/PDF exports.
Top 3 Use Cases
Plot from an equation
Type f(x)=…; see zeros/extrema; optional f'(x). Perfect for analyzing functions and their derivatives.
Graph custom points & fit a line
Paste (x,y); scatter + best-fit line, correlation, equation. Ideal for data analysis and regression.
Parametric motion & distance
Enter x(t), y(t) or v(t); path + running total distance. Great for physics and motion problems.
From problem to picture—see your math clearly.
No credit card. Private by default. Slide-ready exports.